Remember: Tracking of progress is done by the Team itself, so it should not forget to update its BurnDown Chart.
- The BurnDown Chart shows the progress of the Team measured in delivered functionality, not in implemented Tasks.
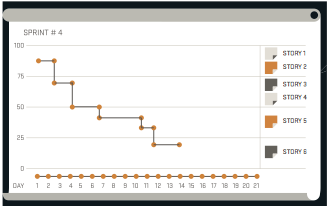
- The vertical axis shows Story Points, the horizontal axis depicts the days of the current Sprint.
- The Team updates the BurnDown Chart on a daily basis.
- In the example above, the Stories which the Team is currently working on during this Sprint are clearly listed on the right hand side.
- The Team should be able to update the BurnDown Chart easily and quickly. Simple solution: Draw the Chart onto a large piece of paper using thick marker pens and place it next to the Taskboard.